Tzigane Data Reporting App
Overview
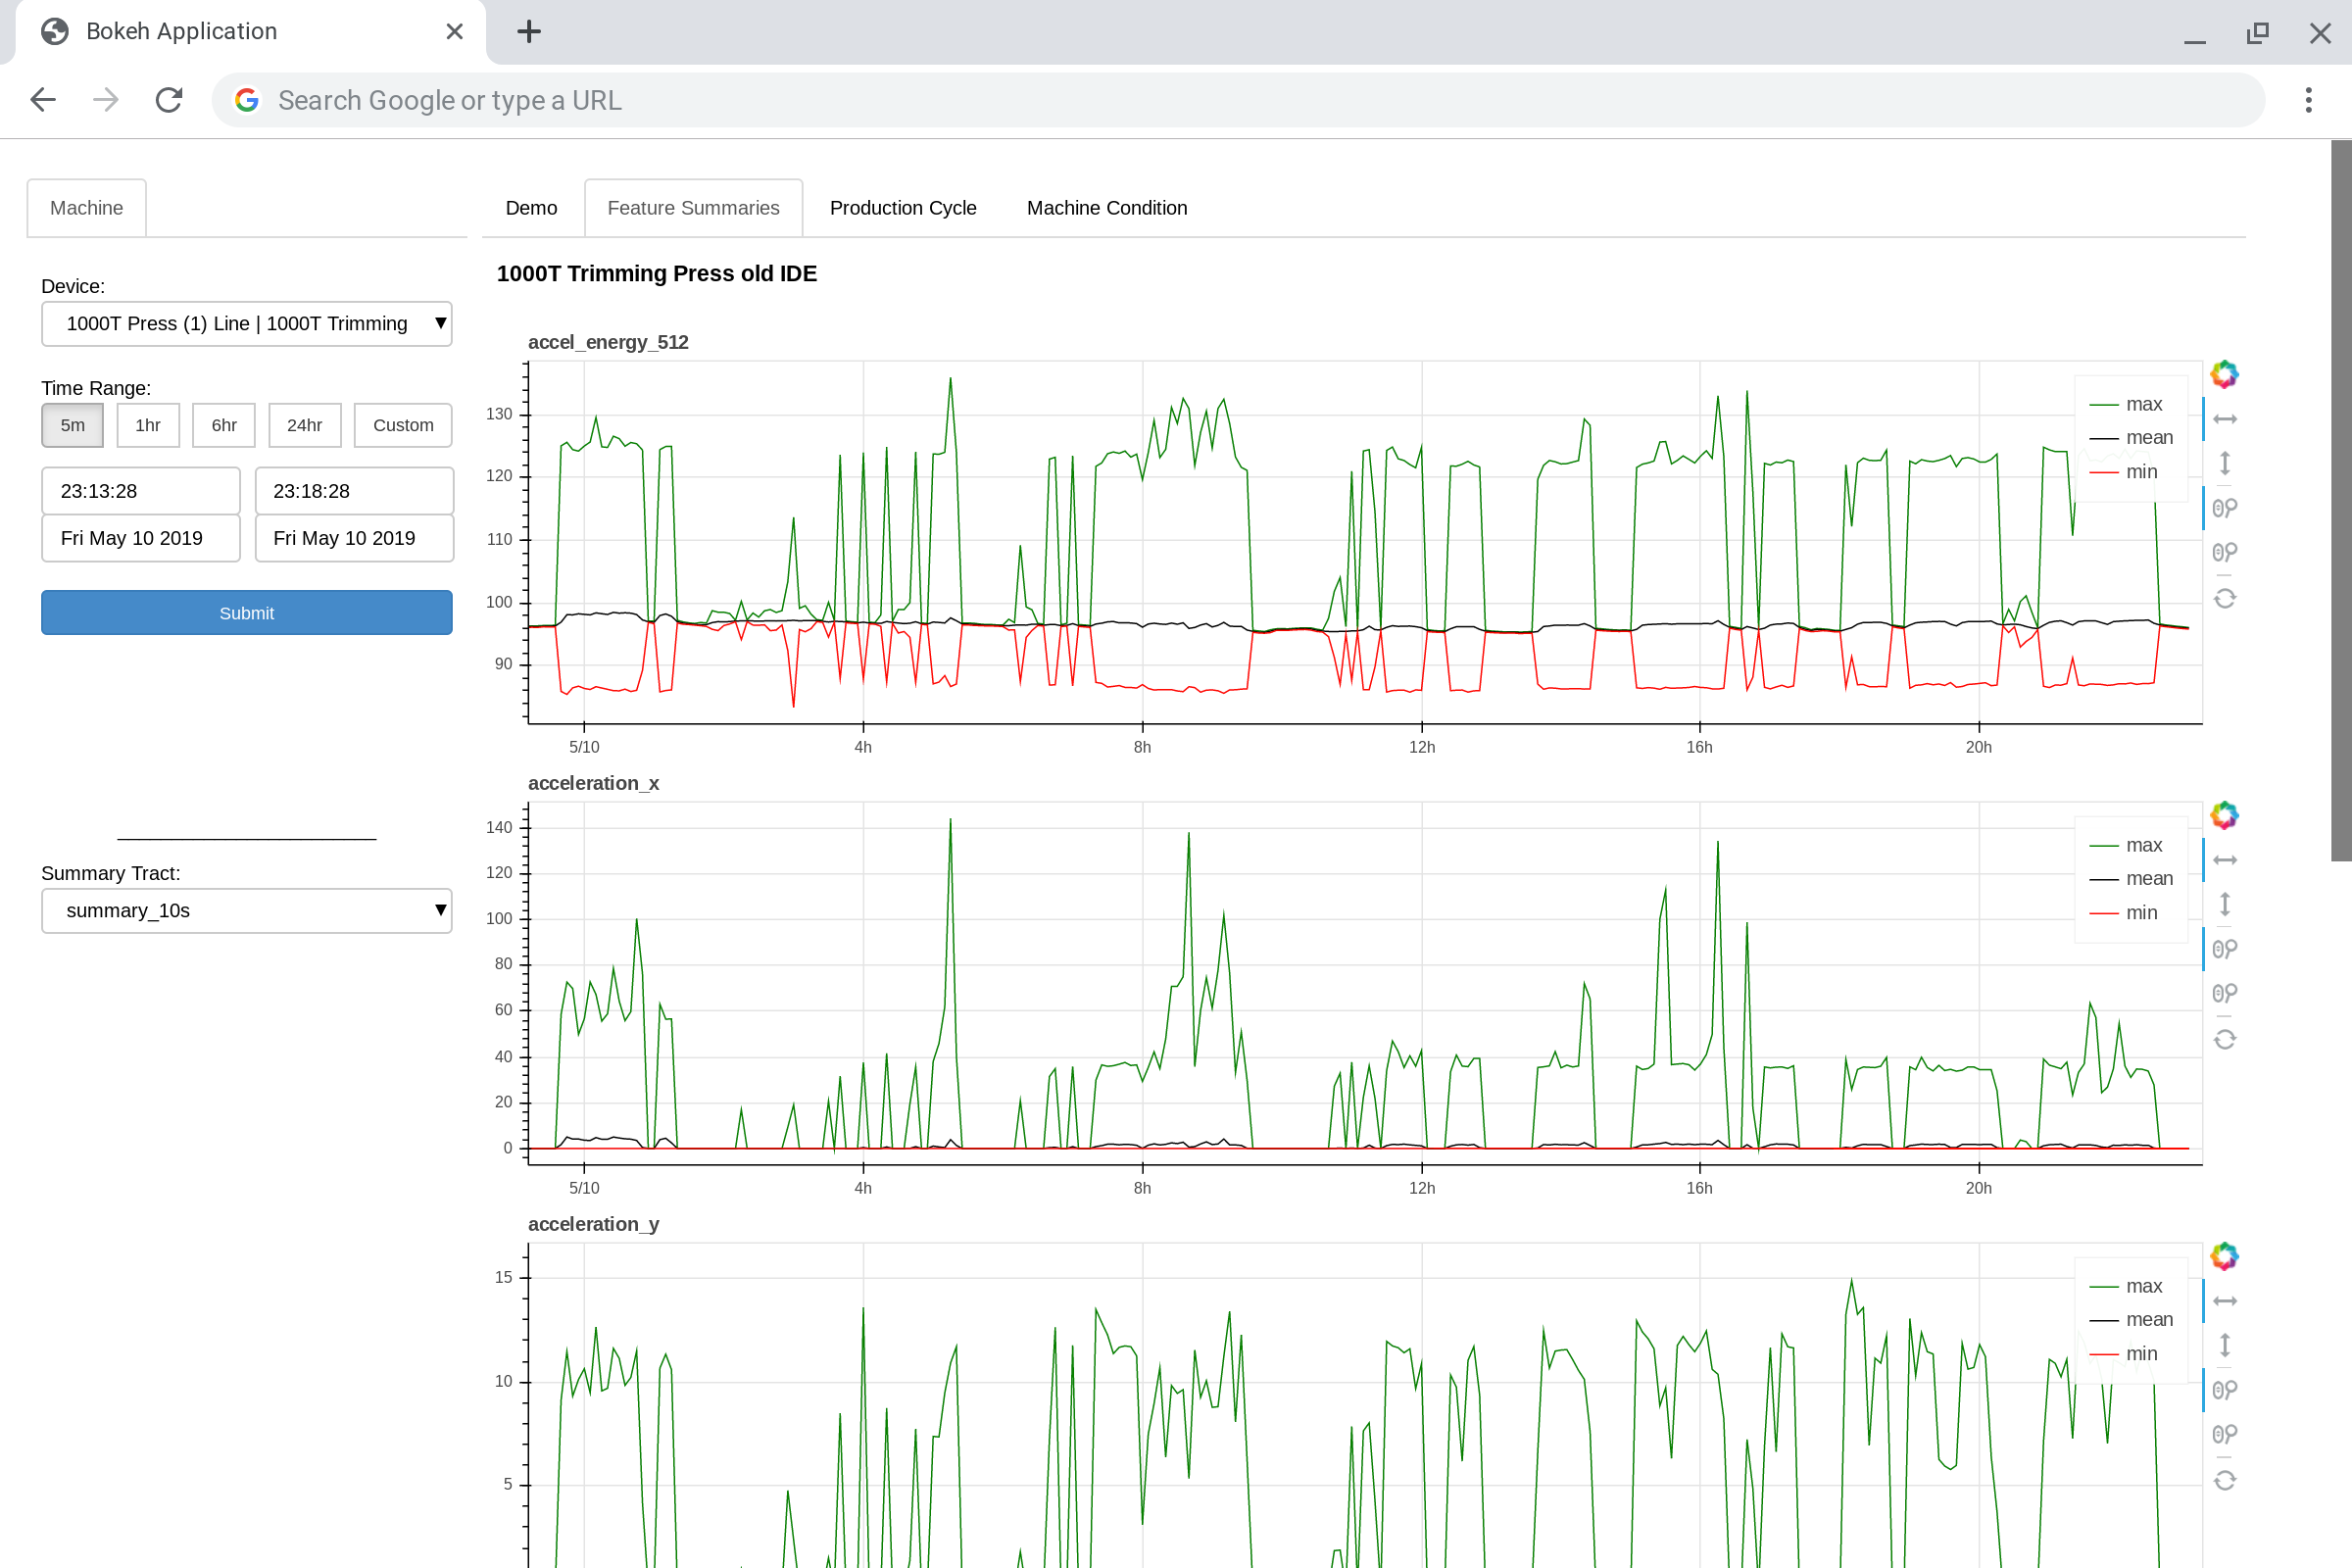
A data visualization/reporting web application using the Bokeh Python library for Infinite Uptime. The application features multiple ‘tabs’ for displaying data in different interactable formats, and a responsive menu for device and time interval selection. It also features data cacheing and automatically adjusts between different data summary tracks to maintain a readable granularity.
The project uses a Bokeh Server running inside a Docker container with a Cloud SQL Proxy. The Bokeh Server serves the application and app data to a Flask server running on a seperate Docker container. Both containers are deployed using Google Compute Engine and Kubernetes.
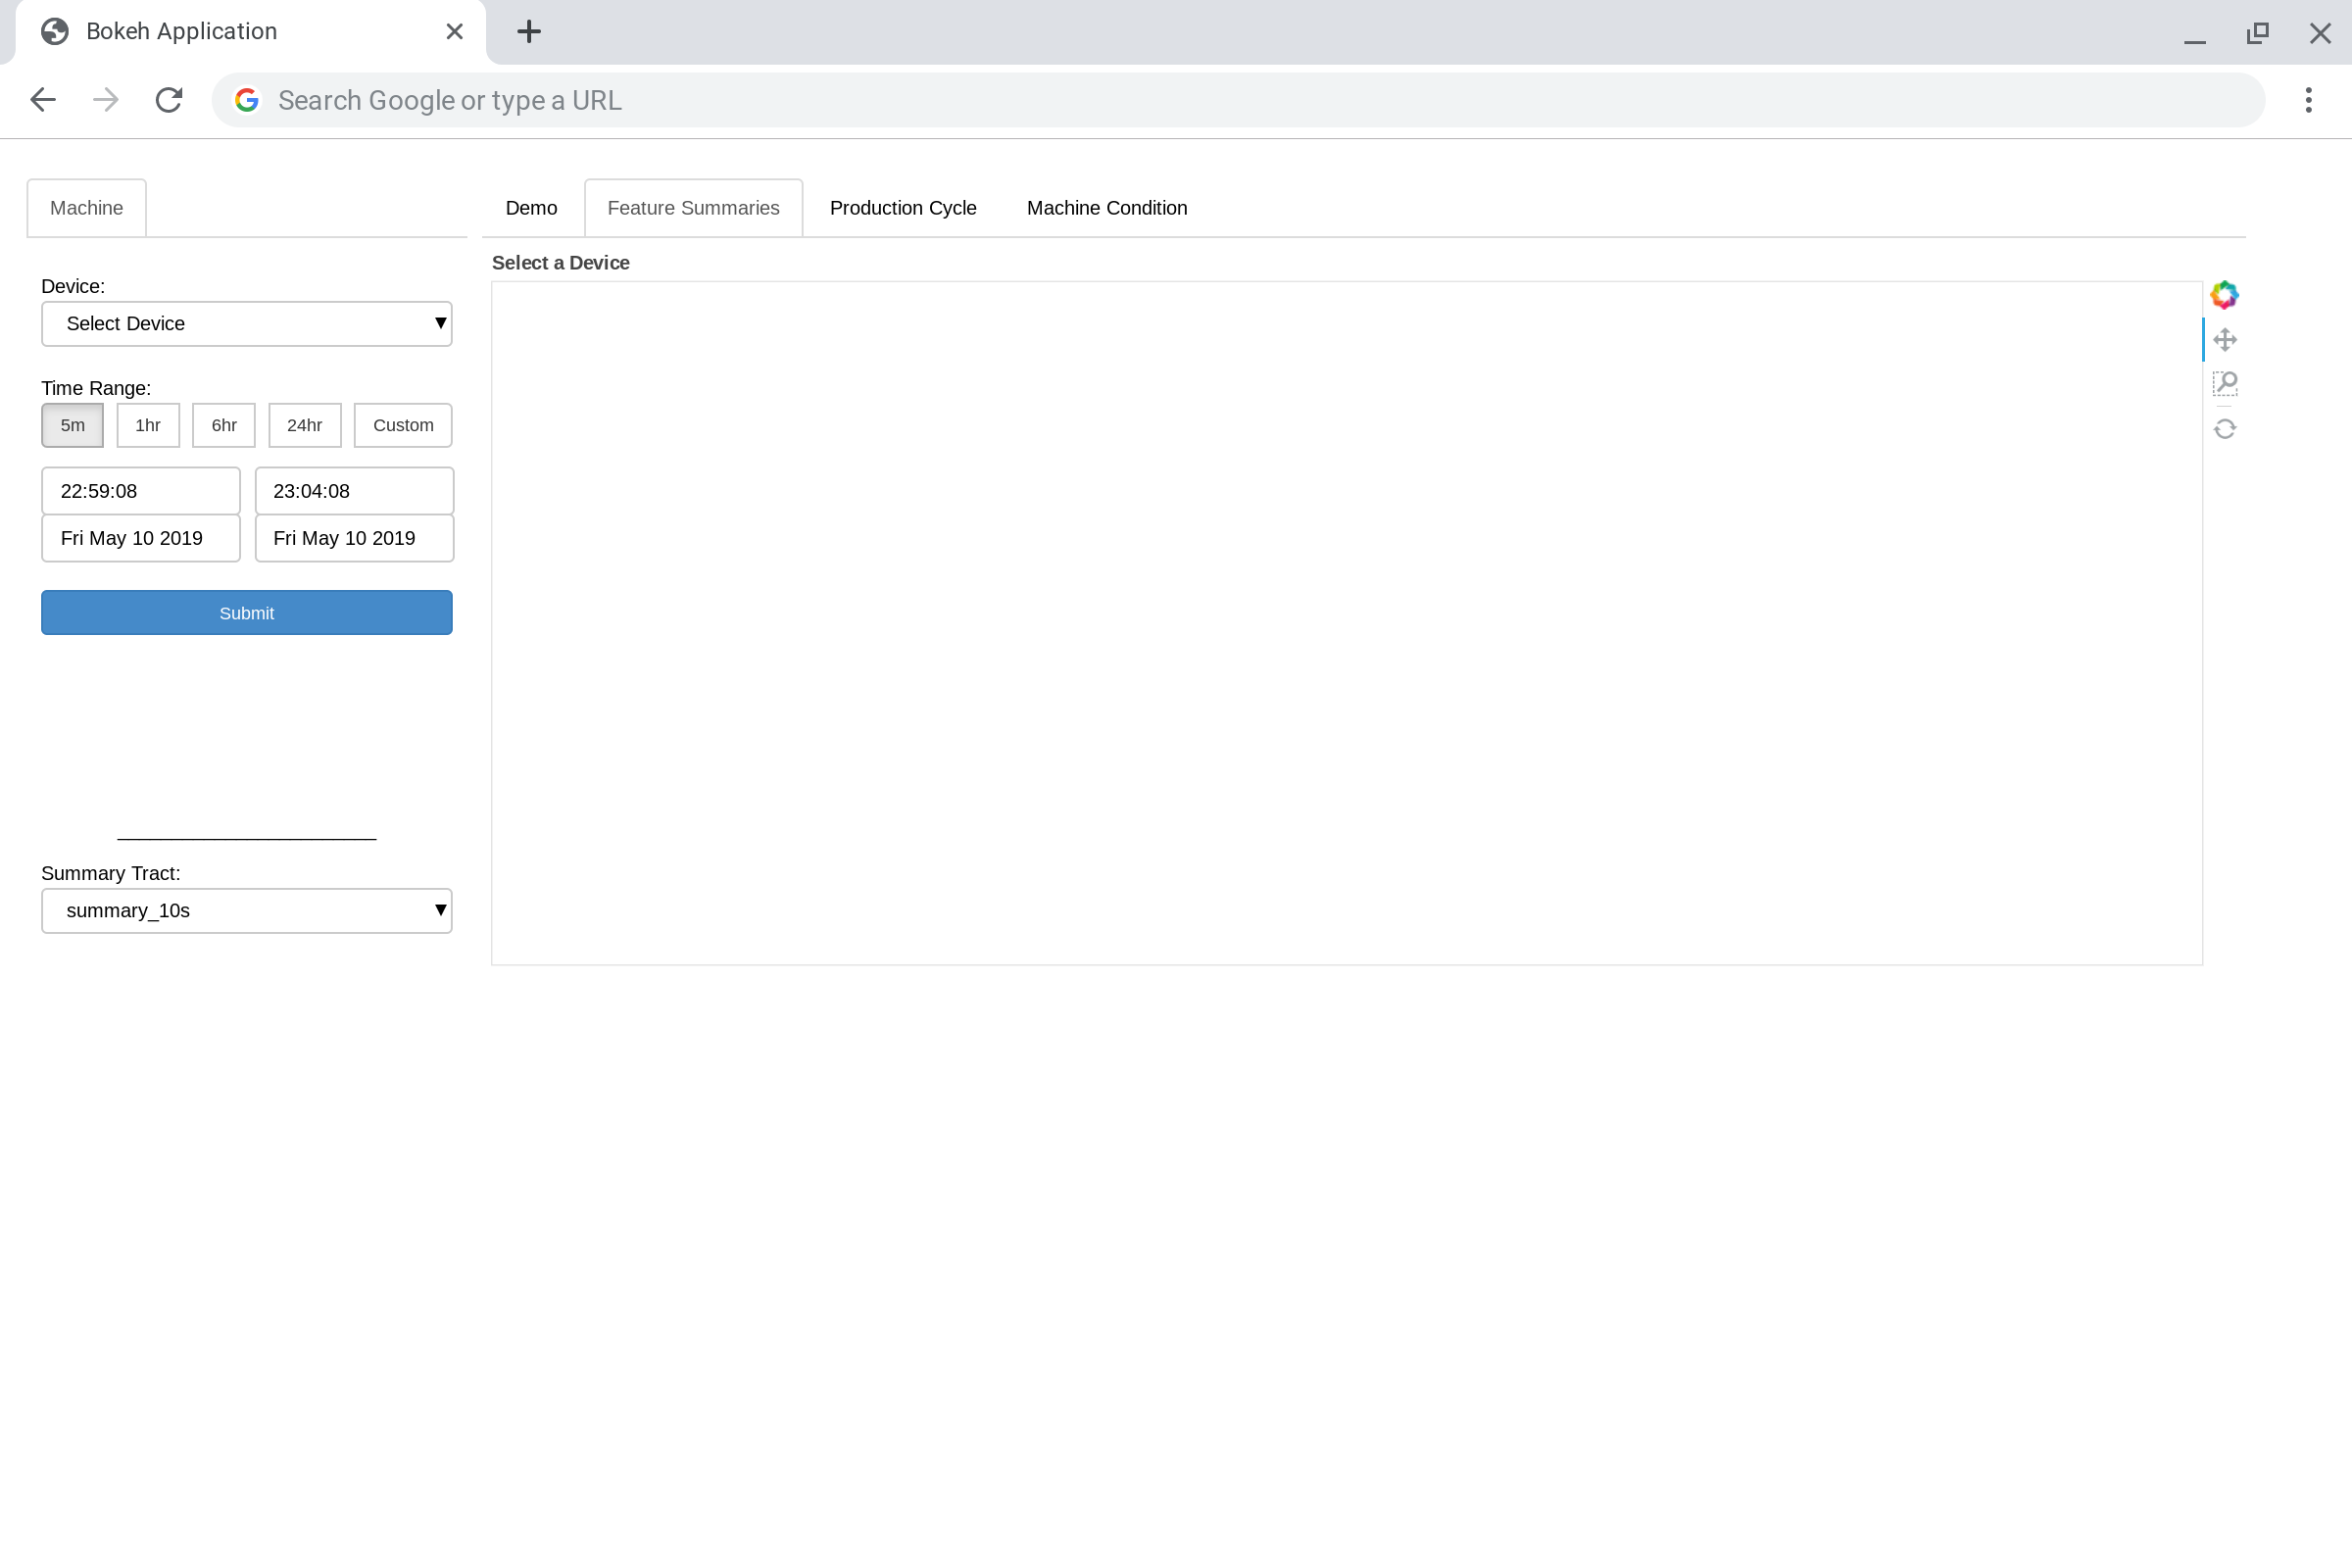
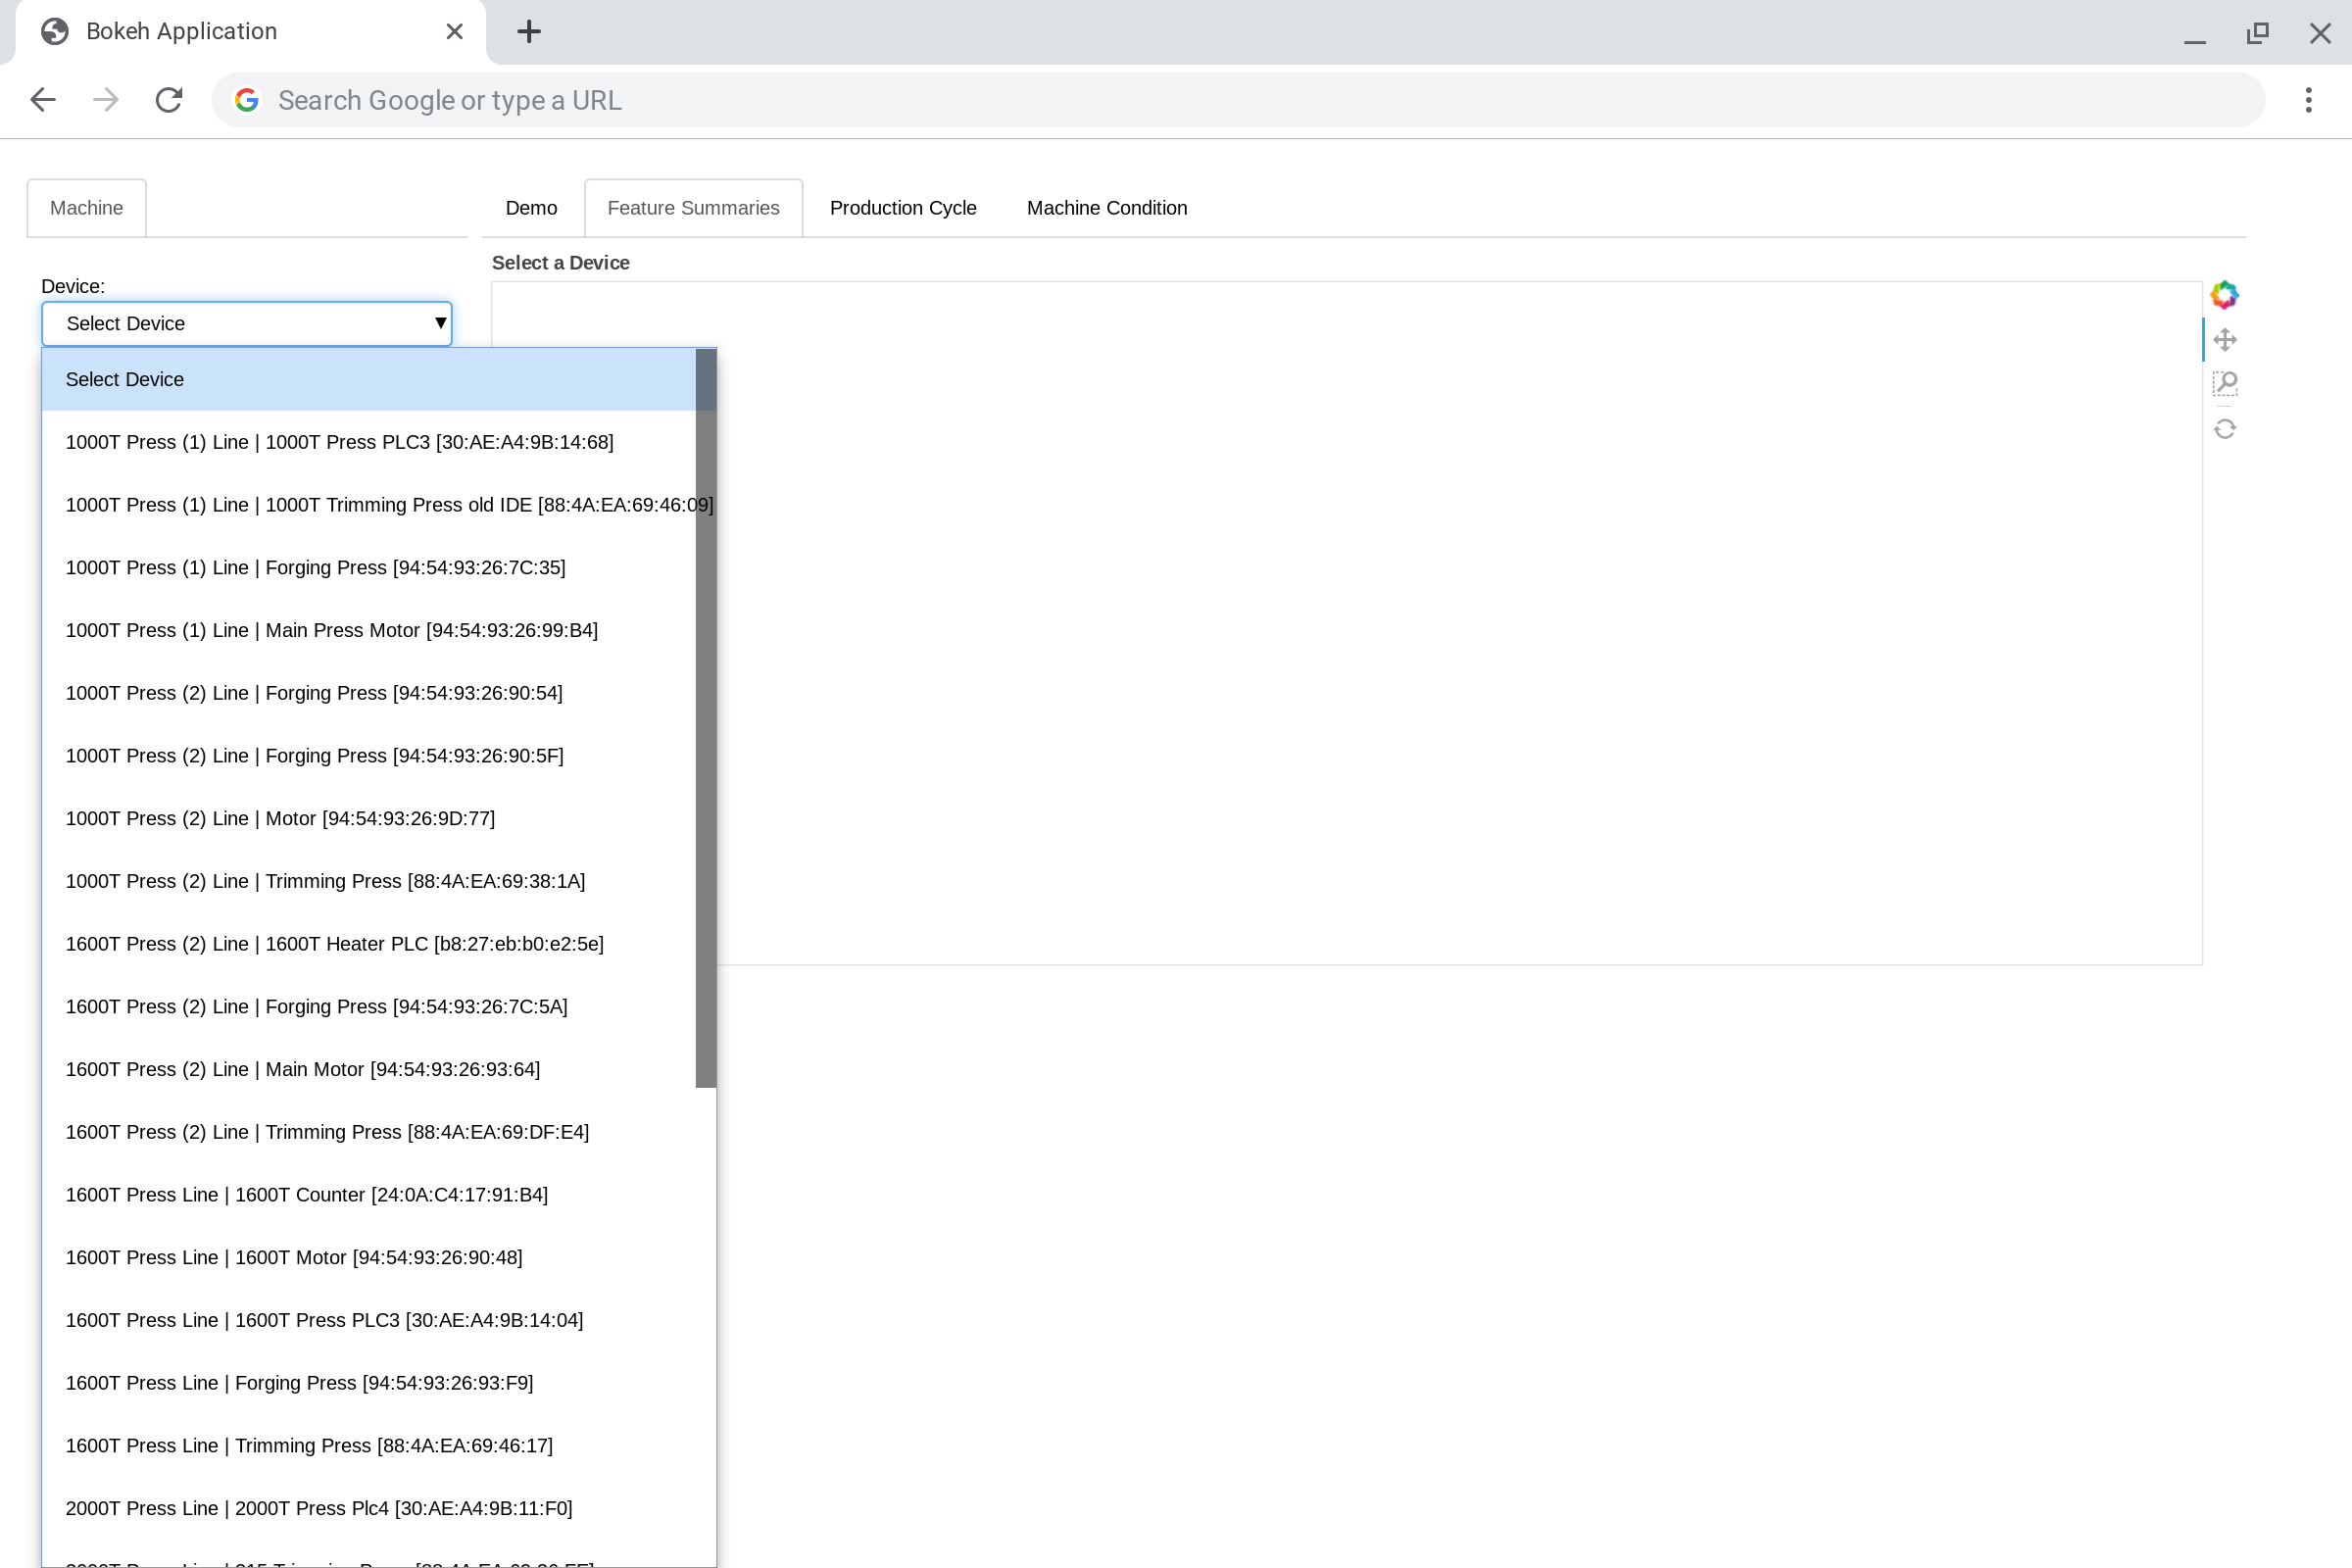
The UI features a responsive navigation bar for selecting different devices associated with an account. The time selector features buttons that autofill the input time and dates, which also respond as you pan and zoom through available data.
The application also changes between different data summaries as you zoom in and out of the data to improve granularity and readibility. It also caches all data loaded in during the session.
The multiple tab system allows for further future development for more views of the data. It opens up development for other interactable views for both general and specific clientele use, using any features offered by the Bokeh library.
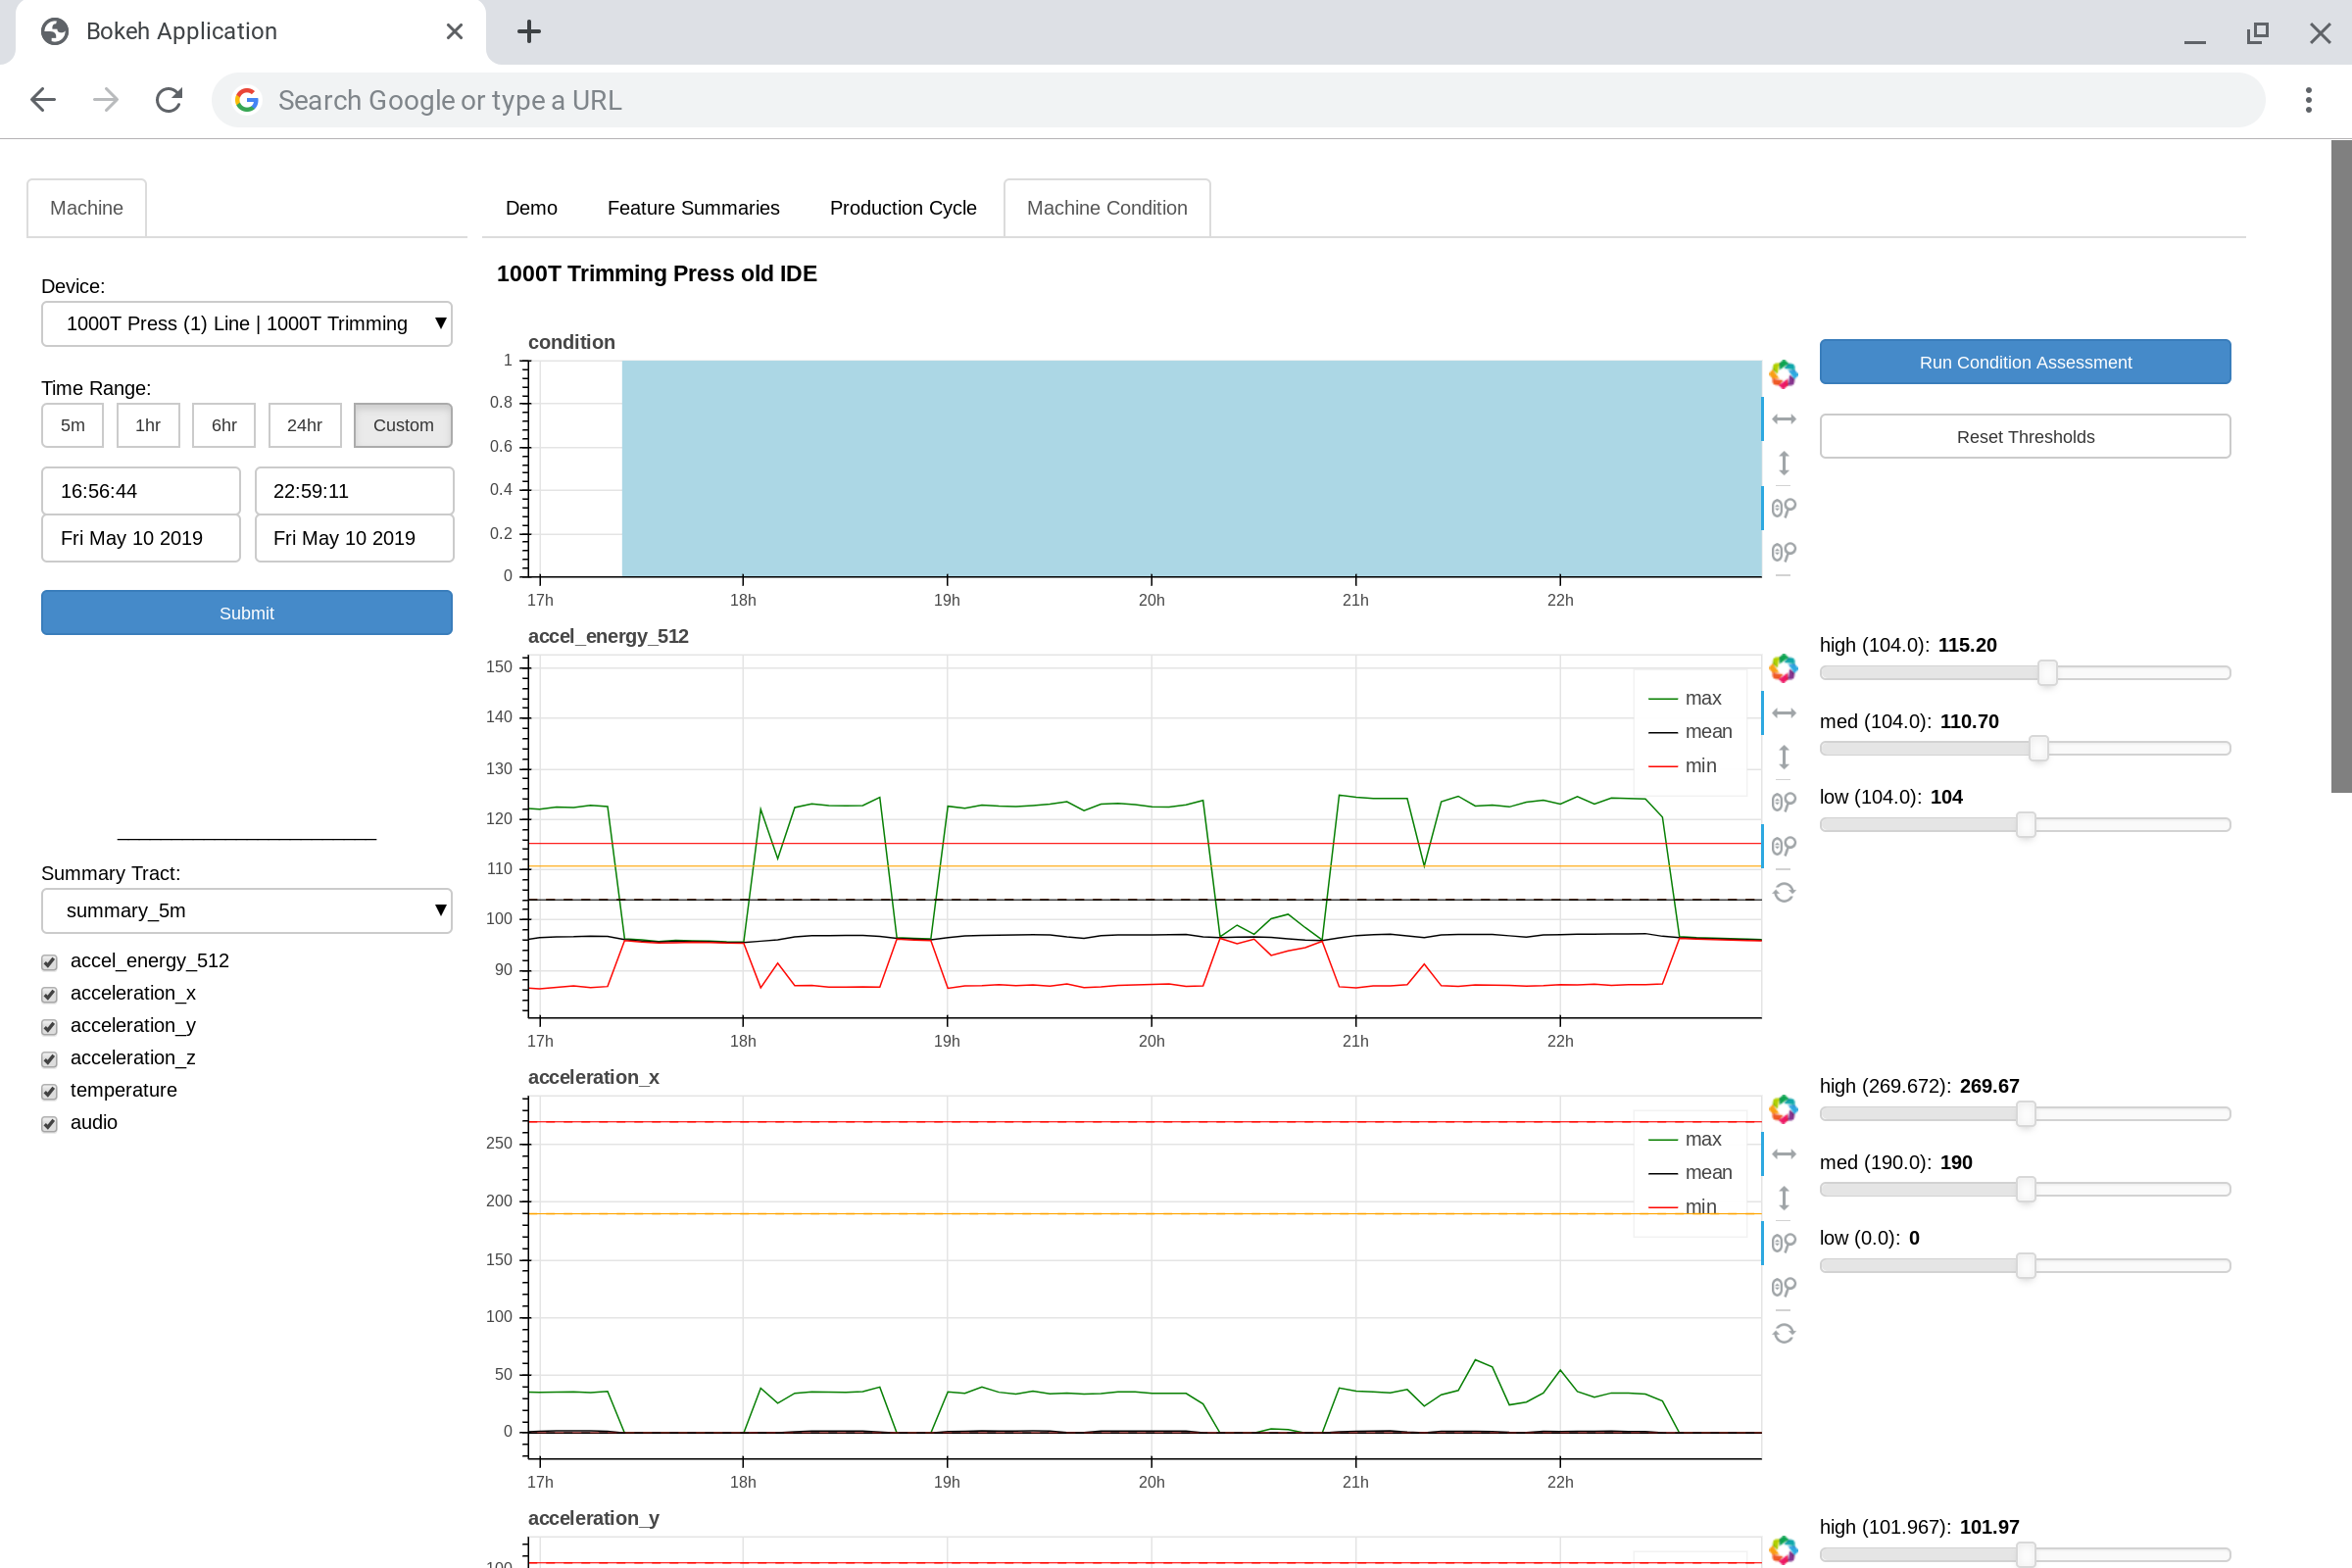
A primary example includes inspecting machine conditions, which allows you to set high, med, and low baseline values and inspect when/where a machine exceeds those values.


